Evaluation
This story comes from the video-viewing and continuous-reporting task in MER-PS. We analyse released data, with no new collection or deployment experiment. Records from existing interface research also test how the same rules apply across uses.
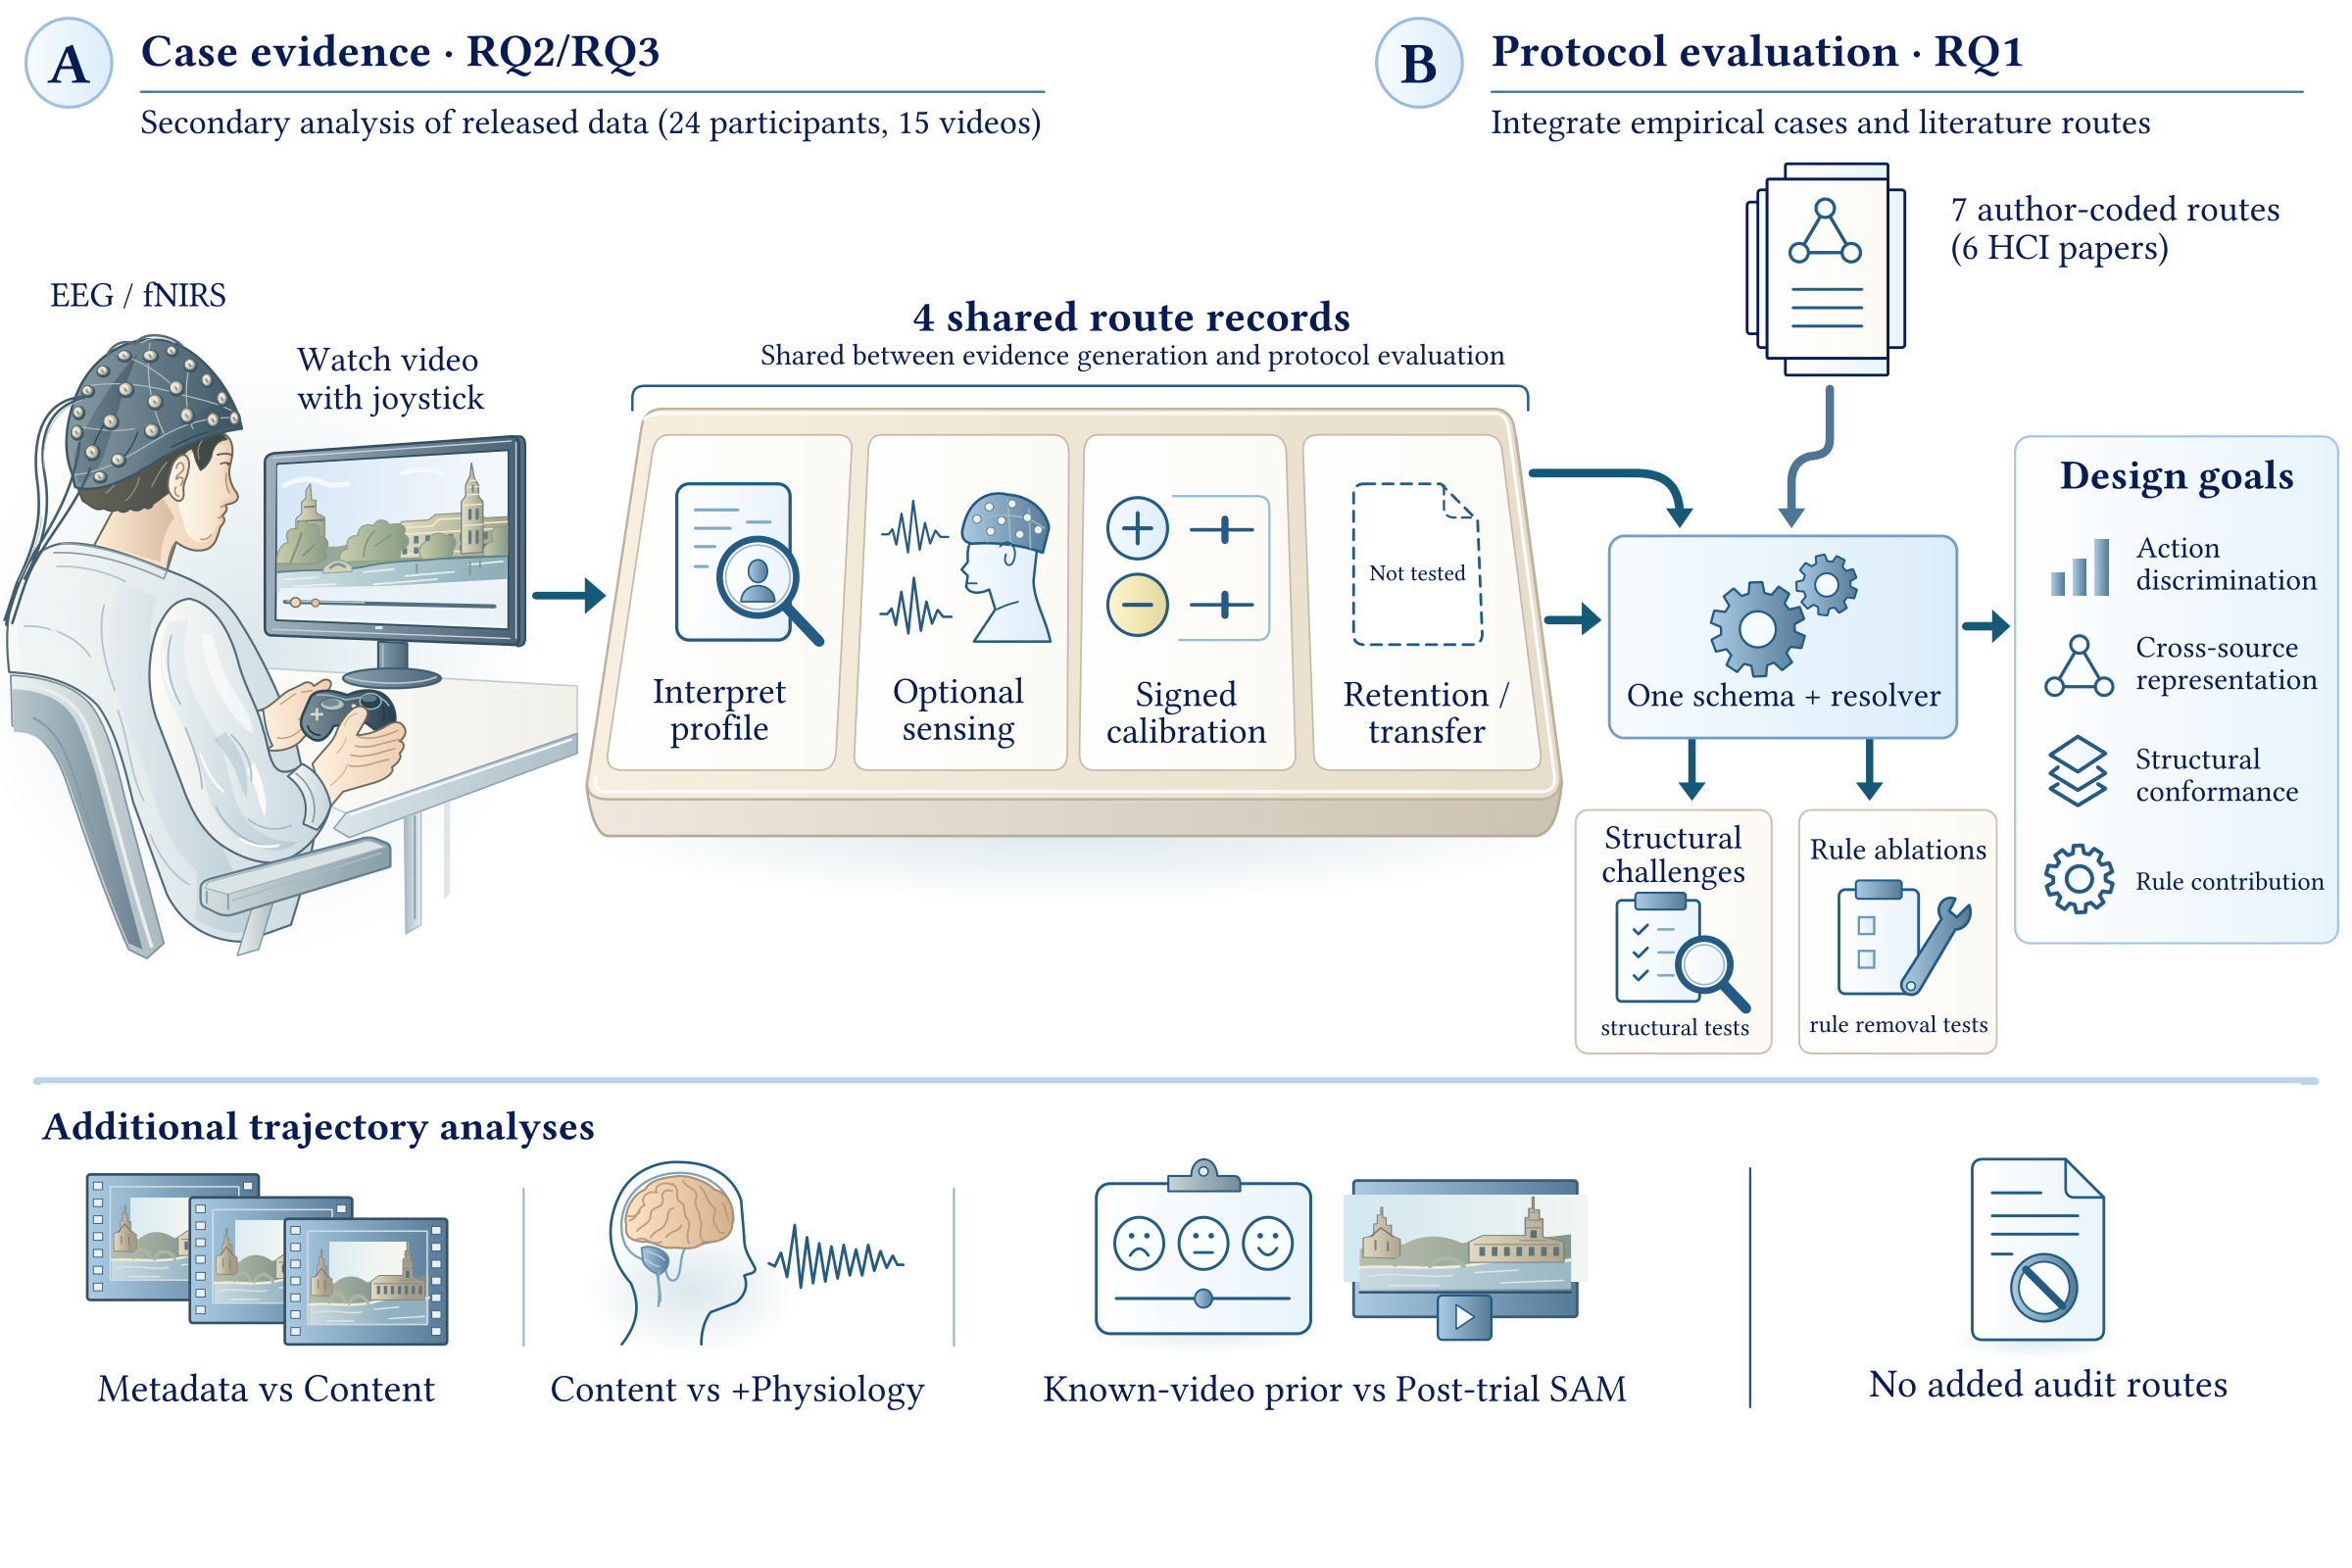
Rule Tests RQ1
We used four records from this study and seven author-coded records from six papers to check whether the rules run as defined.
The external records were prepared by this study’s authors; they are not independent validation of the judgments.
Data Analysis RQ2 / RQ3
We analysed reports from 24 participants watching 15 videos and measured timing differences from reference reports. These measurements form the candidate profile, used to study evidence for interpretation, sensing, calibration, and reuse.
Data and Analysis Details
The 360 trials in MER-PS used one session, a fixed video library, and the same two-dimensional joystick interface. Continuous valence–arousal reports use a 1–255 scale.
Scalar sensing and cross-video calibration use five outer and four inner participant folds. Content and physiological trajectory analyses hold out both participants and released videos; SAM reconstruction holds out participants while using same-video training reports. References, targets, scaling, and model selection are rebuilt within the applicable training boundary.
Scalar timing-deviation error is in seconds; trajectory error is in joystick label units. Uncertainty and split sensitivity describe development on this release, not an untouched confirmatory cohort.
Statistical analysis registry