Results
Rule TestsRQ1
Two author-coded records from one menu study led to different actions: keep the tested static menu for the proposed automatic adaptation; allow user customization within the evaluated conditions. Menu case records ↗
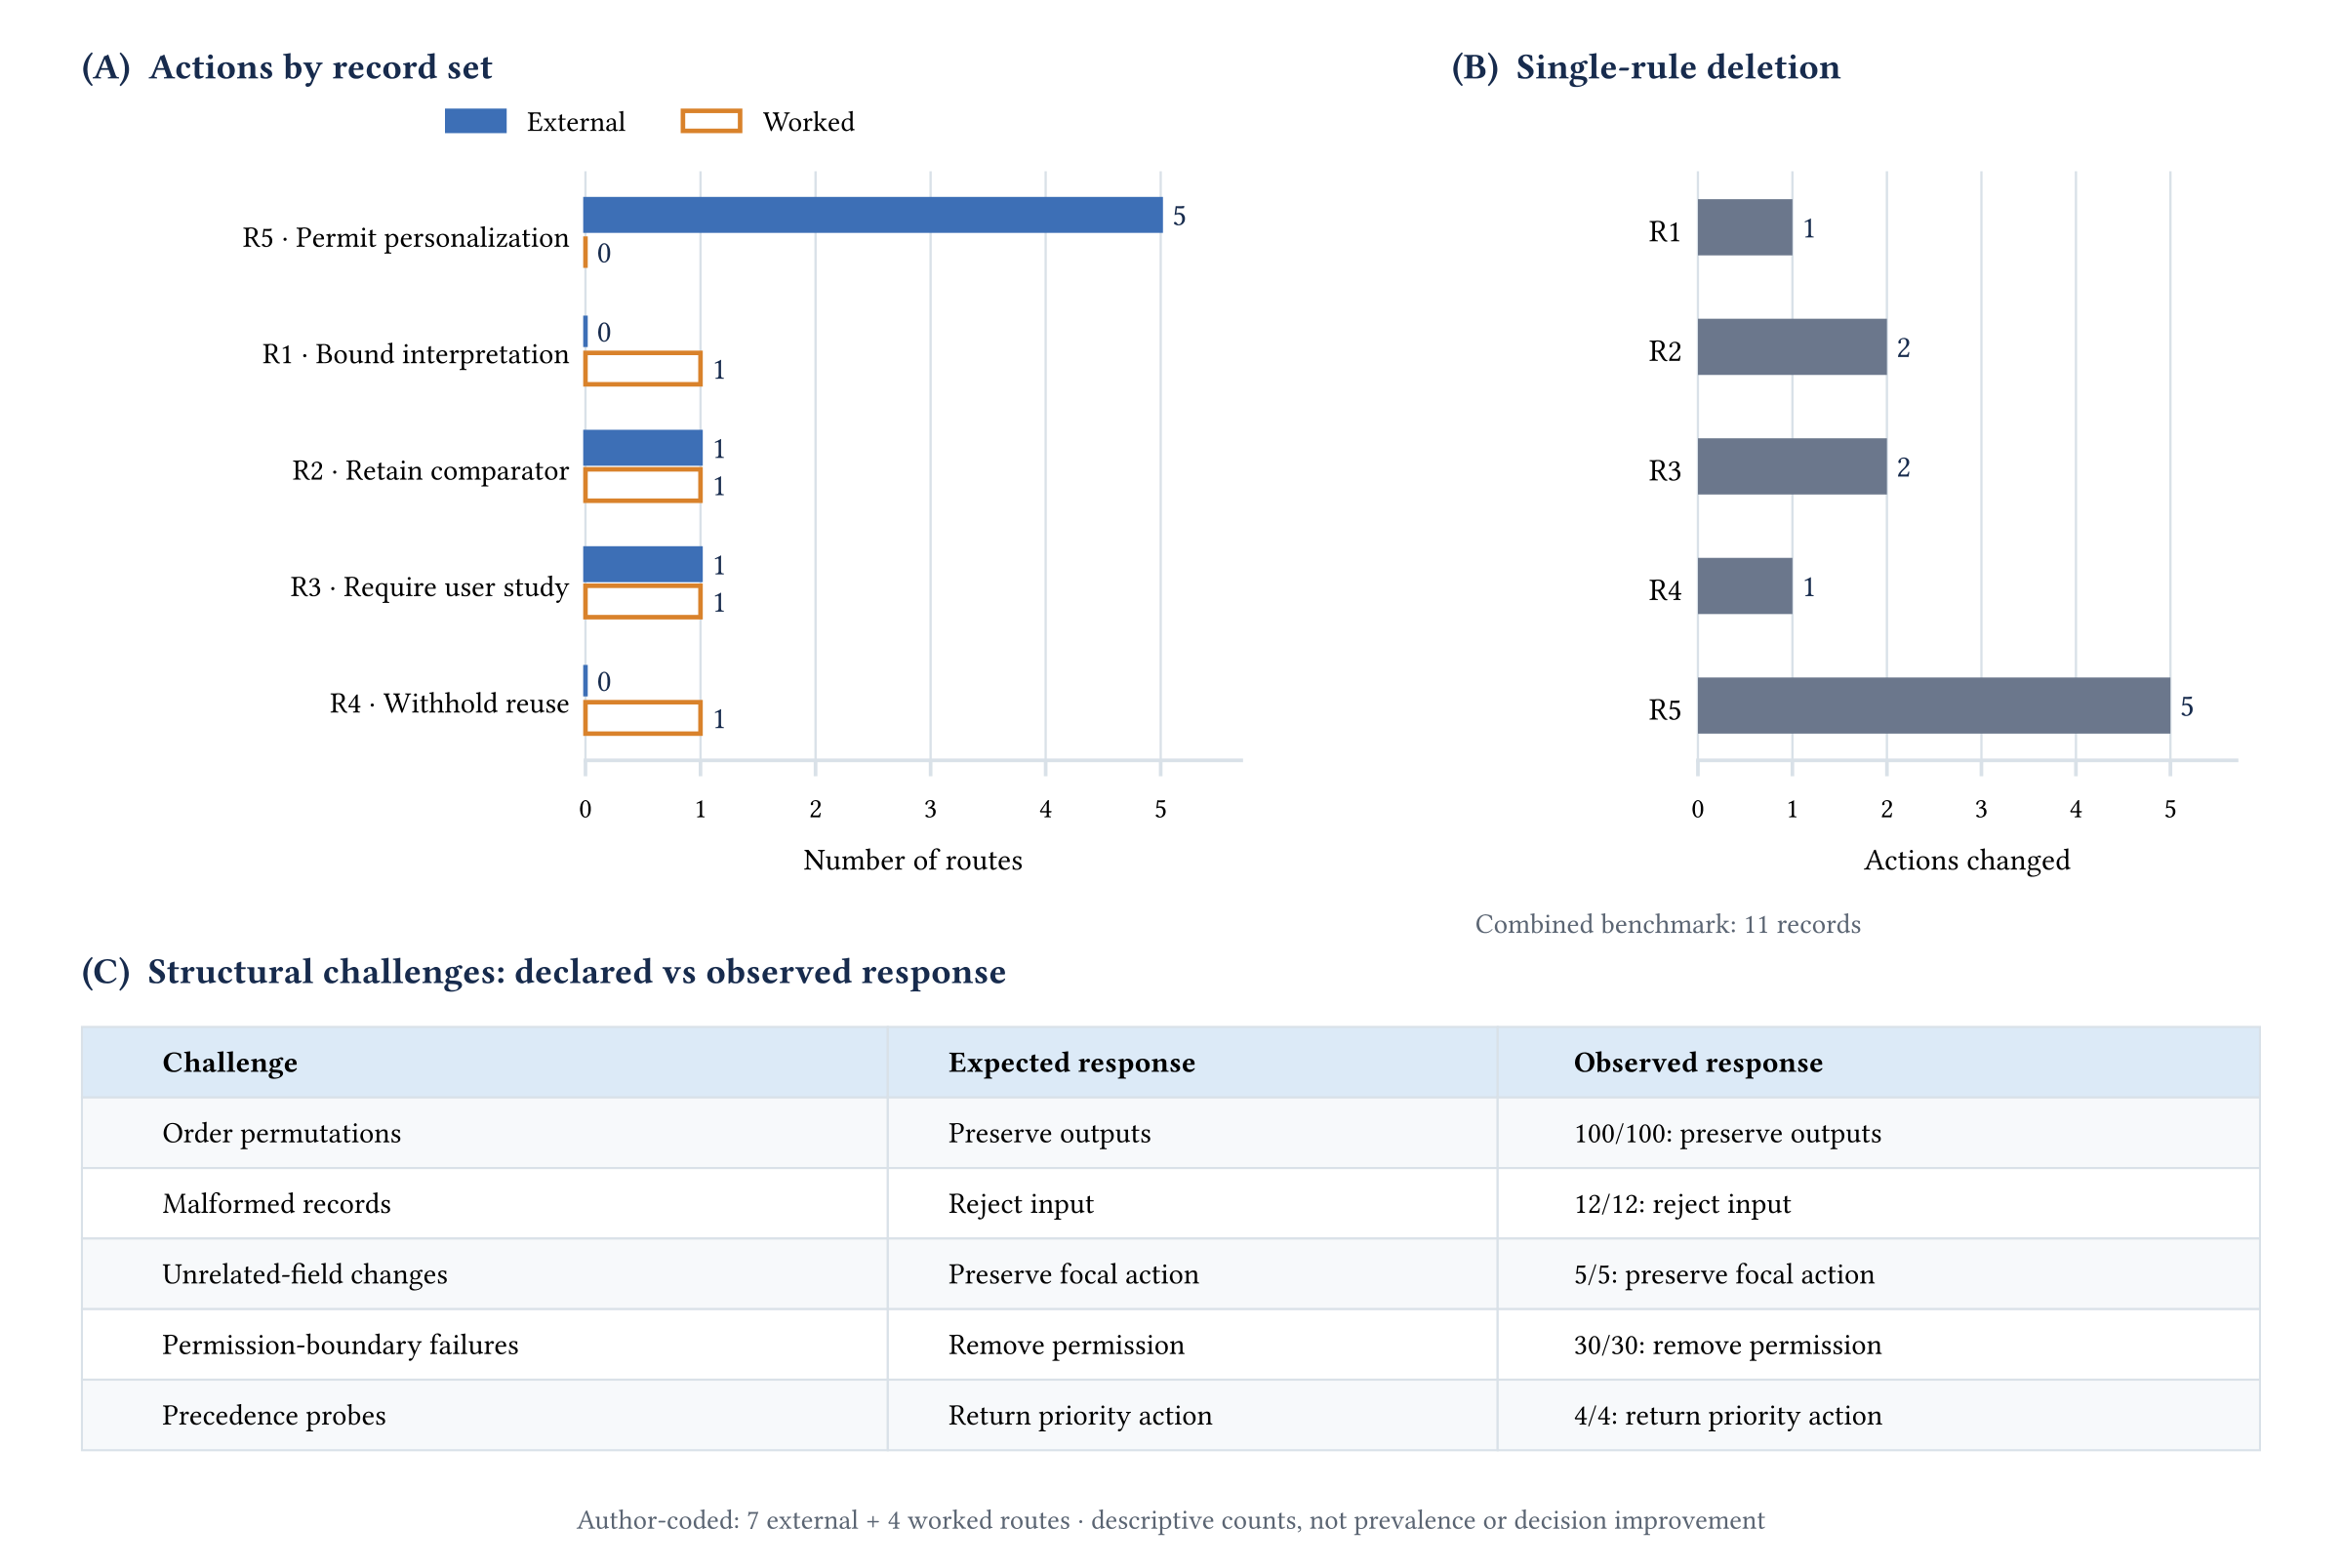
The four study records and seven external records cover all five action categories, including five conditional permissions. Removing any one rule changed at least one decision.
These checks show that the program follows its rules. They do not establish that the judgments are correct or that real decisions improve.
Structural checks and source records
| Challenge | Expected response | Observed |
|---|---|---|
| Order permutations | Preserve outputs | 100 / 100 |
| Malformed records | Reject input | 12 / 12 |
| Unrelated-field changes | Preserve the focal action | 5 / 5 |
| Permission-boundary failures | Remove permission | 30 / 30 |
| Overlapping constraints | Follow declared priority | 4 / 4 |
The order tests shuffle graph nodes, edges, artifact-registry entries, rule-list entries, case lists, and external-source entries. Declared priority values remain fixed; the resolver sorts rules by priority before deciding. This is not a test of changing the priority policy.
The permitted uses were a user-adaptable menu, ability-based generated interfaces, a culturally adaptive website, exposed body-sensing calibration, and conservative menu adaptation. Each permission remains inside its source study’s evaluated boundary.
Profile InterpretationRQ2
Estimated timing differences change with the calculation method and reference group.
The reference comes from other people’s self-reports; it is not emotional ground truth.
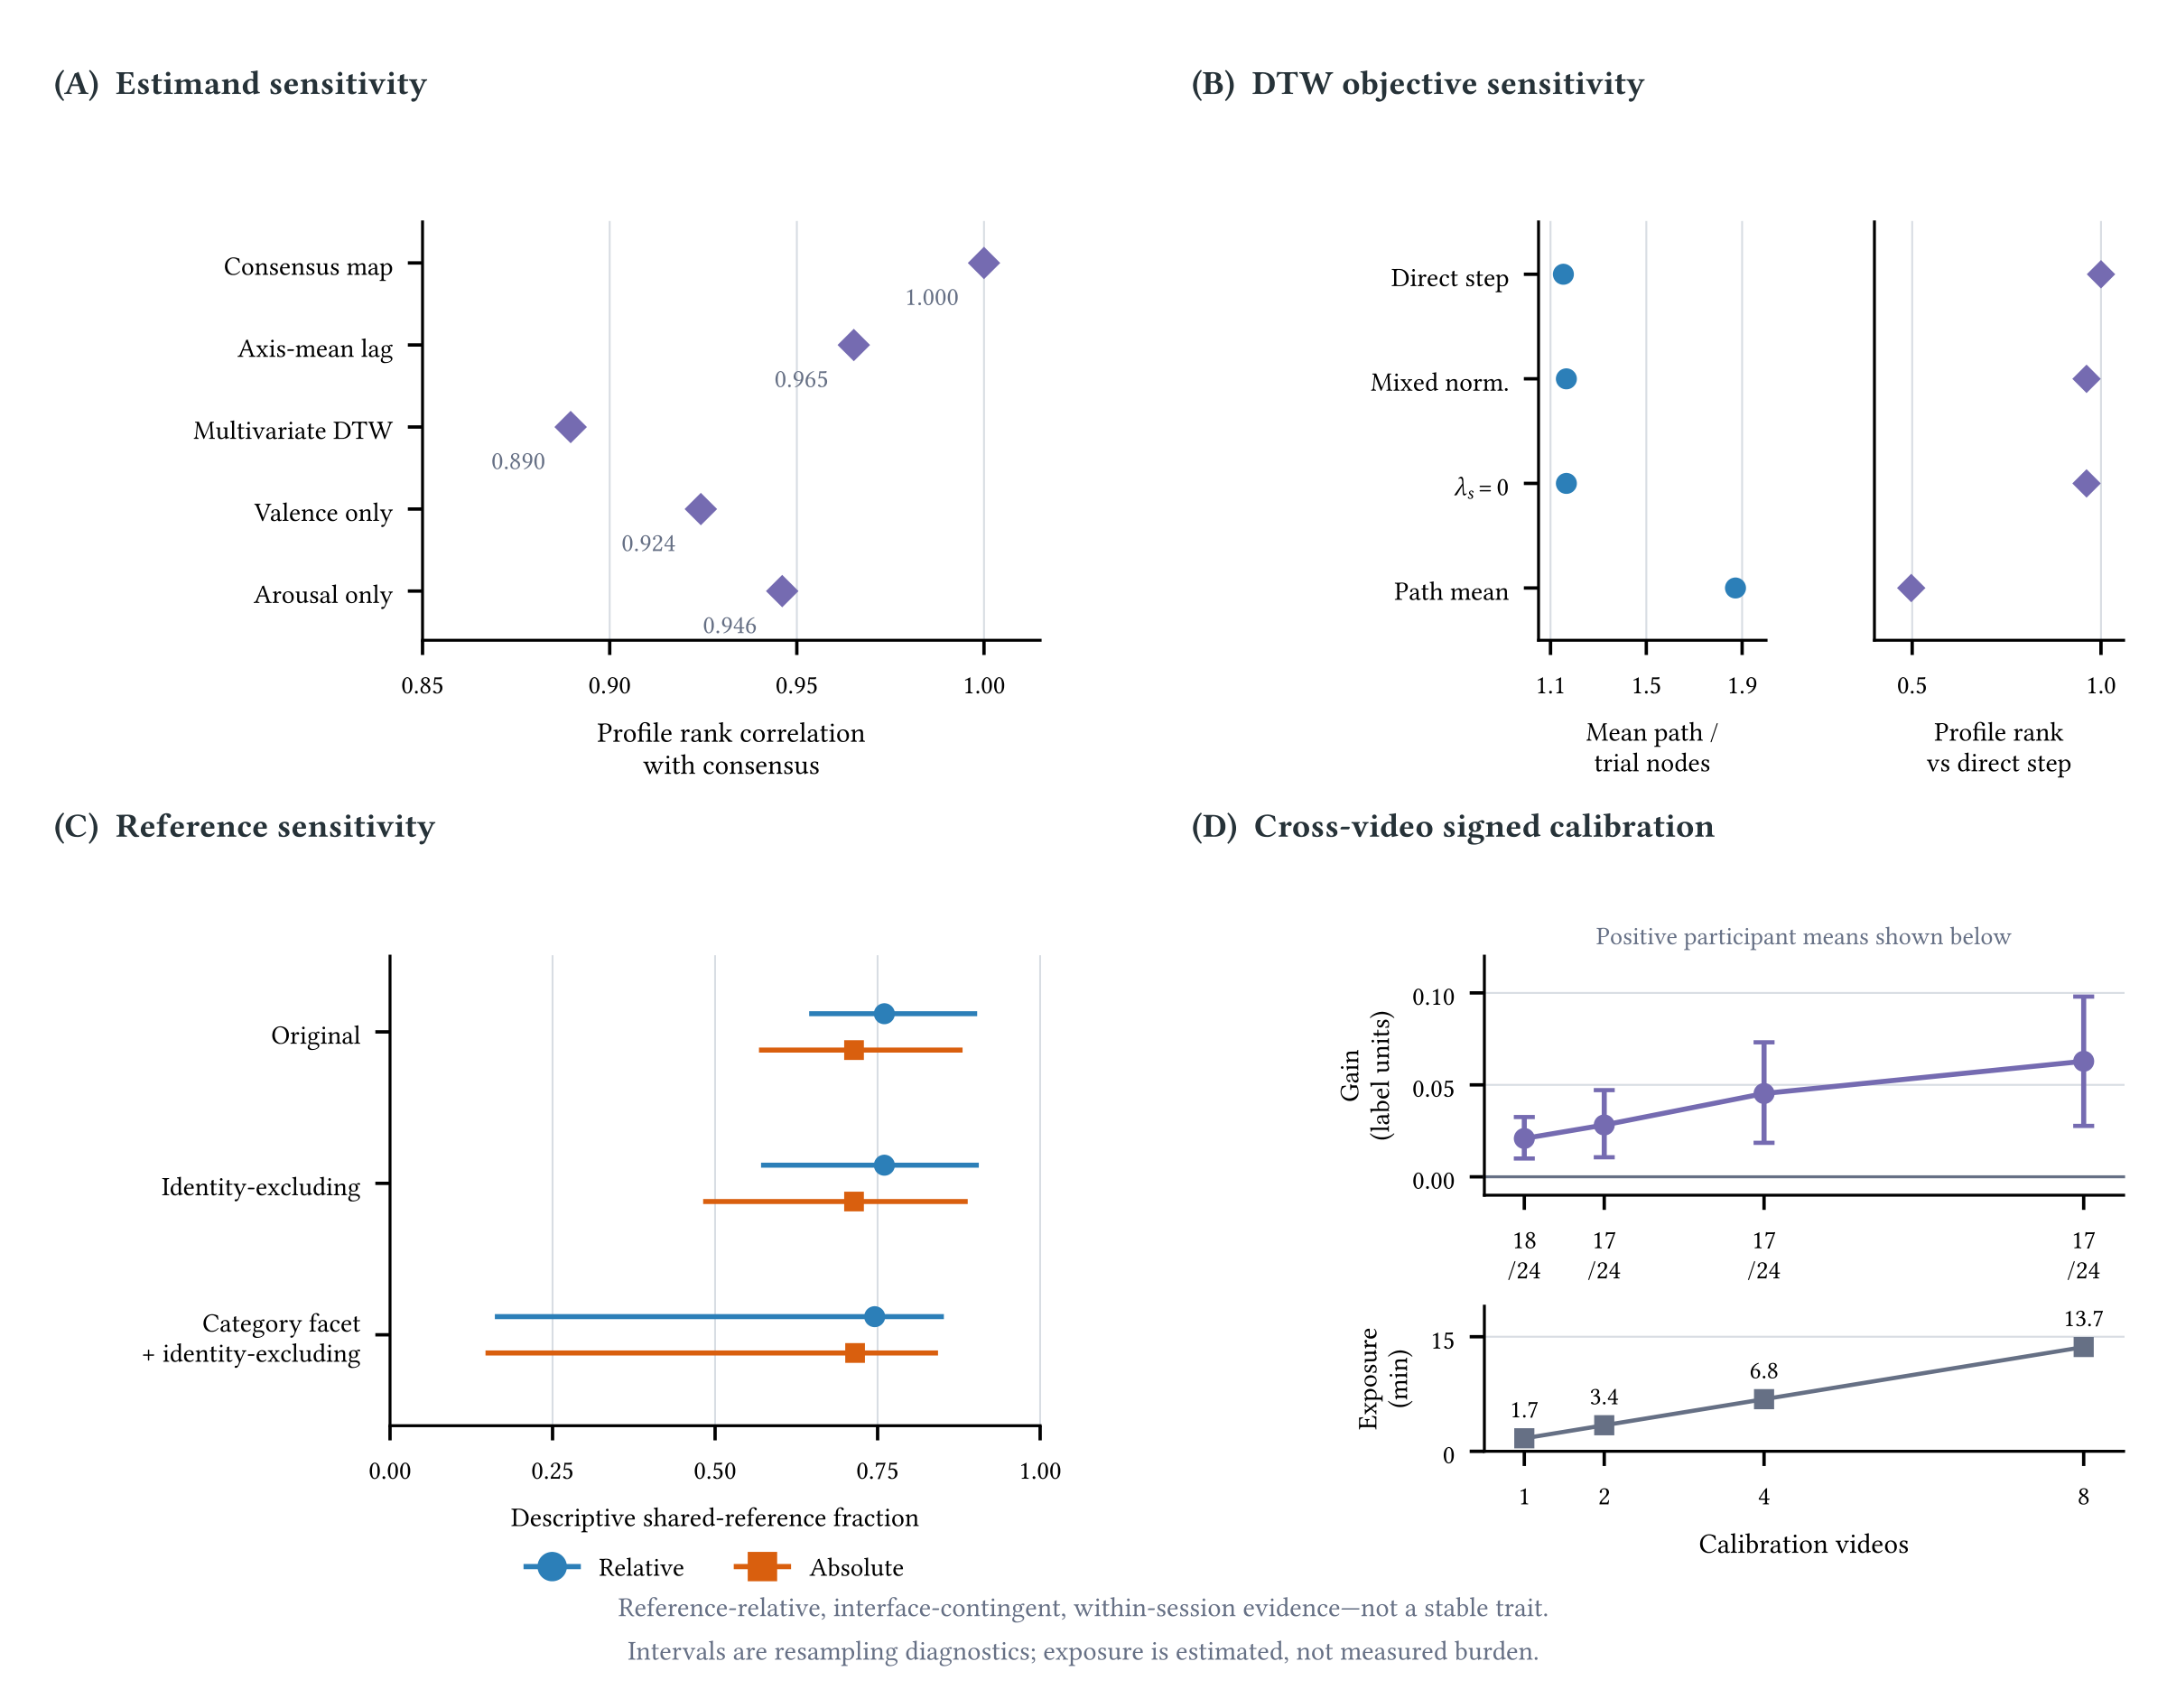
Changing the alignment objective reduced profile-rank agreement to 0.497; changing the reference cohort shifted one profile by up to 0.459 seconds.
Use these differences only to describe the tested conditions, not as an established personal trait. R1 limits interpretation; it does not authorize automatic interface changes.
Additional measurement evidence
Within a trial, timing alignment on one reporting axis helped the other. The axes share a hand, joystick, task, and clock. Across videos, the supported transfer was only a small constant signed shift; it did not establish a persistent personal timing pattern.
Alternative profile definitions had rank correlations of 0.890–0.965 with the consensus definition. Path-mean normalization increased timing magnitude by 0.783 seconds (95% CI 0.570–0.989). Relative and absolute shared-reference variance fractions were 0.760 and 0.714; these describe sensitivity under dependent, overlapping references.
View sourceAdded InformationRQ3
Do added sensors or user feedback improve on the tested comparator?
Added Sensors
For timing-magnitude prediction without the target-video self-report, the tested sensor stack did not demonstrate improvement over video mean. Errors are in seconds.
| Measure | Value |
|---|---|
| Video-mean MAE | 0.763 s |
| Sensor-stack MAE | 0.794 s |
| Gain over video mean (95% CI) | -0.031 s [-0.081,0.014] |
For this task, the added sensors lack demonstrated benefit, so R2 keeps the video-mean comparator. This neither rules out all physiological sensing nor establishes equivalence.
Report Calibration
A correction learned from other videos lowered held-out reference error compared with video-only calibration (Fig. 4D).
| Calibration videos | Gain (label units) |
|---|---|
| 1 | 0.021 |
| 2 | 0.028 |
| 4 | 0.045 |
| 8 | 0.063 |
Better metrics alone do not justify automatic adaptation. R3 calls for a preregistered study in actual use, with direct user outcomes and benefit and harm criteria specified in advance.
Trajectory Analysis
Three additional analyses estimate continuous self-report curves, with errors in label units. They add evidence, not formal review records.
| Condition and available information | Matched comparator | MAE | Gain |
|---|---|---|---|
| Video content · full video available before playback | Matched comparatorMetadata: category, duration, phase MAE 31.333 | MAE30.493 | Gain0.840 |
| Physiology: content + current and past EEG/fNIRS | Matched comparatorFixed content prior MAE 30.493 | MAE30.499 | Gain-0.006 |
| Post-trial SAM: one rating pair + same-video training reports | Matched comparatorKnown-video population prior, no target feedback MAE 28.417 | MAE26.289 | Gain2.127 95% CI [0.557,3.878] |
MAE and gains are in label units. Lower MAE is better; gain is comparator error minus candidate error. Information timing and validation splits differ across rows, so this is not one ranking.
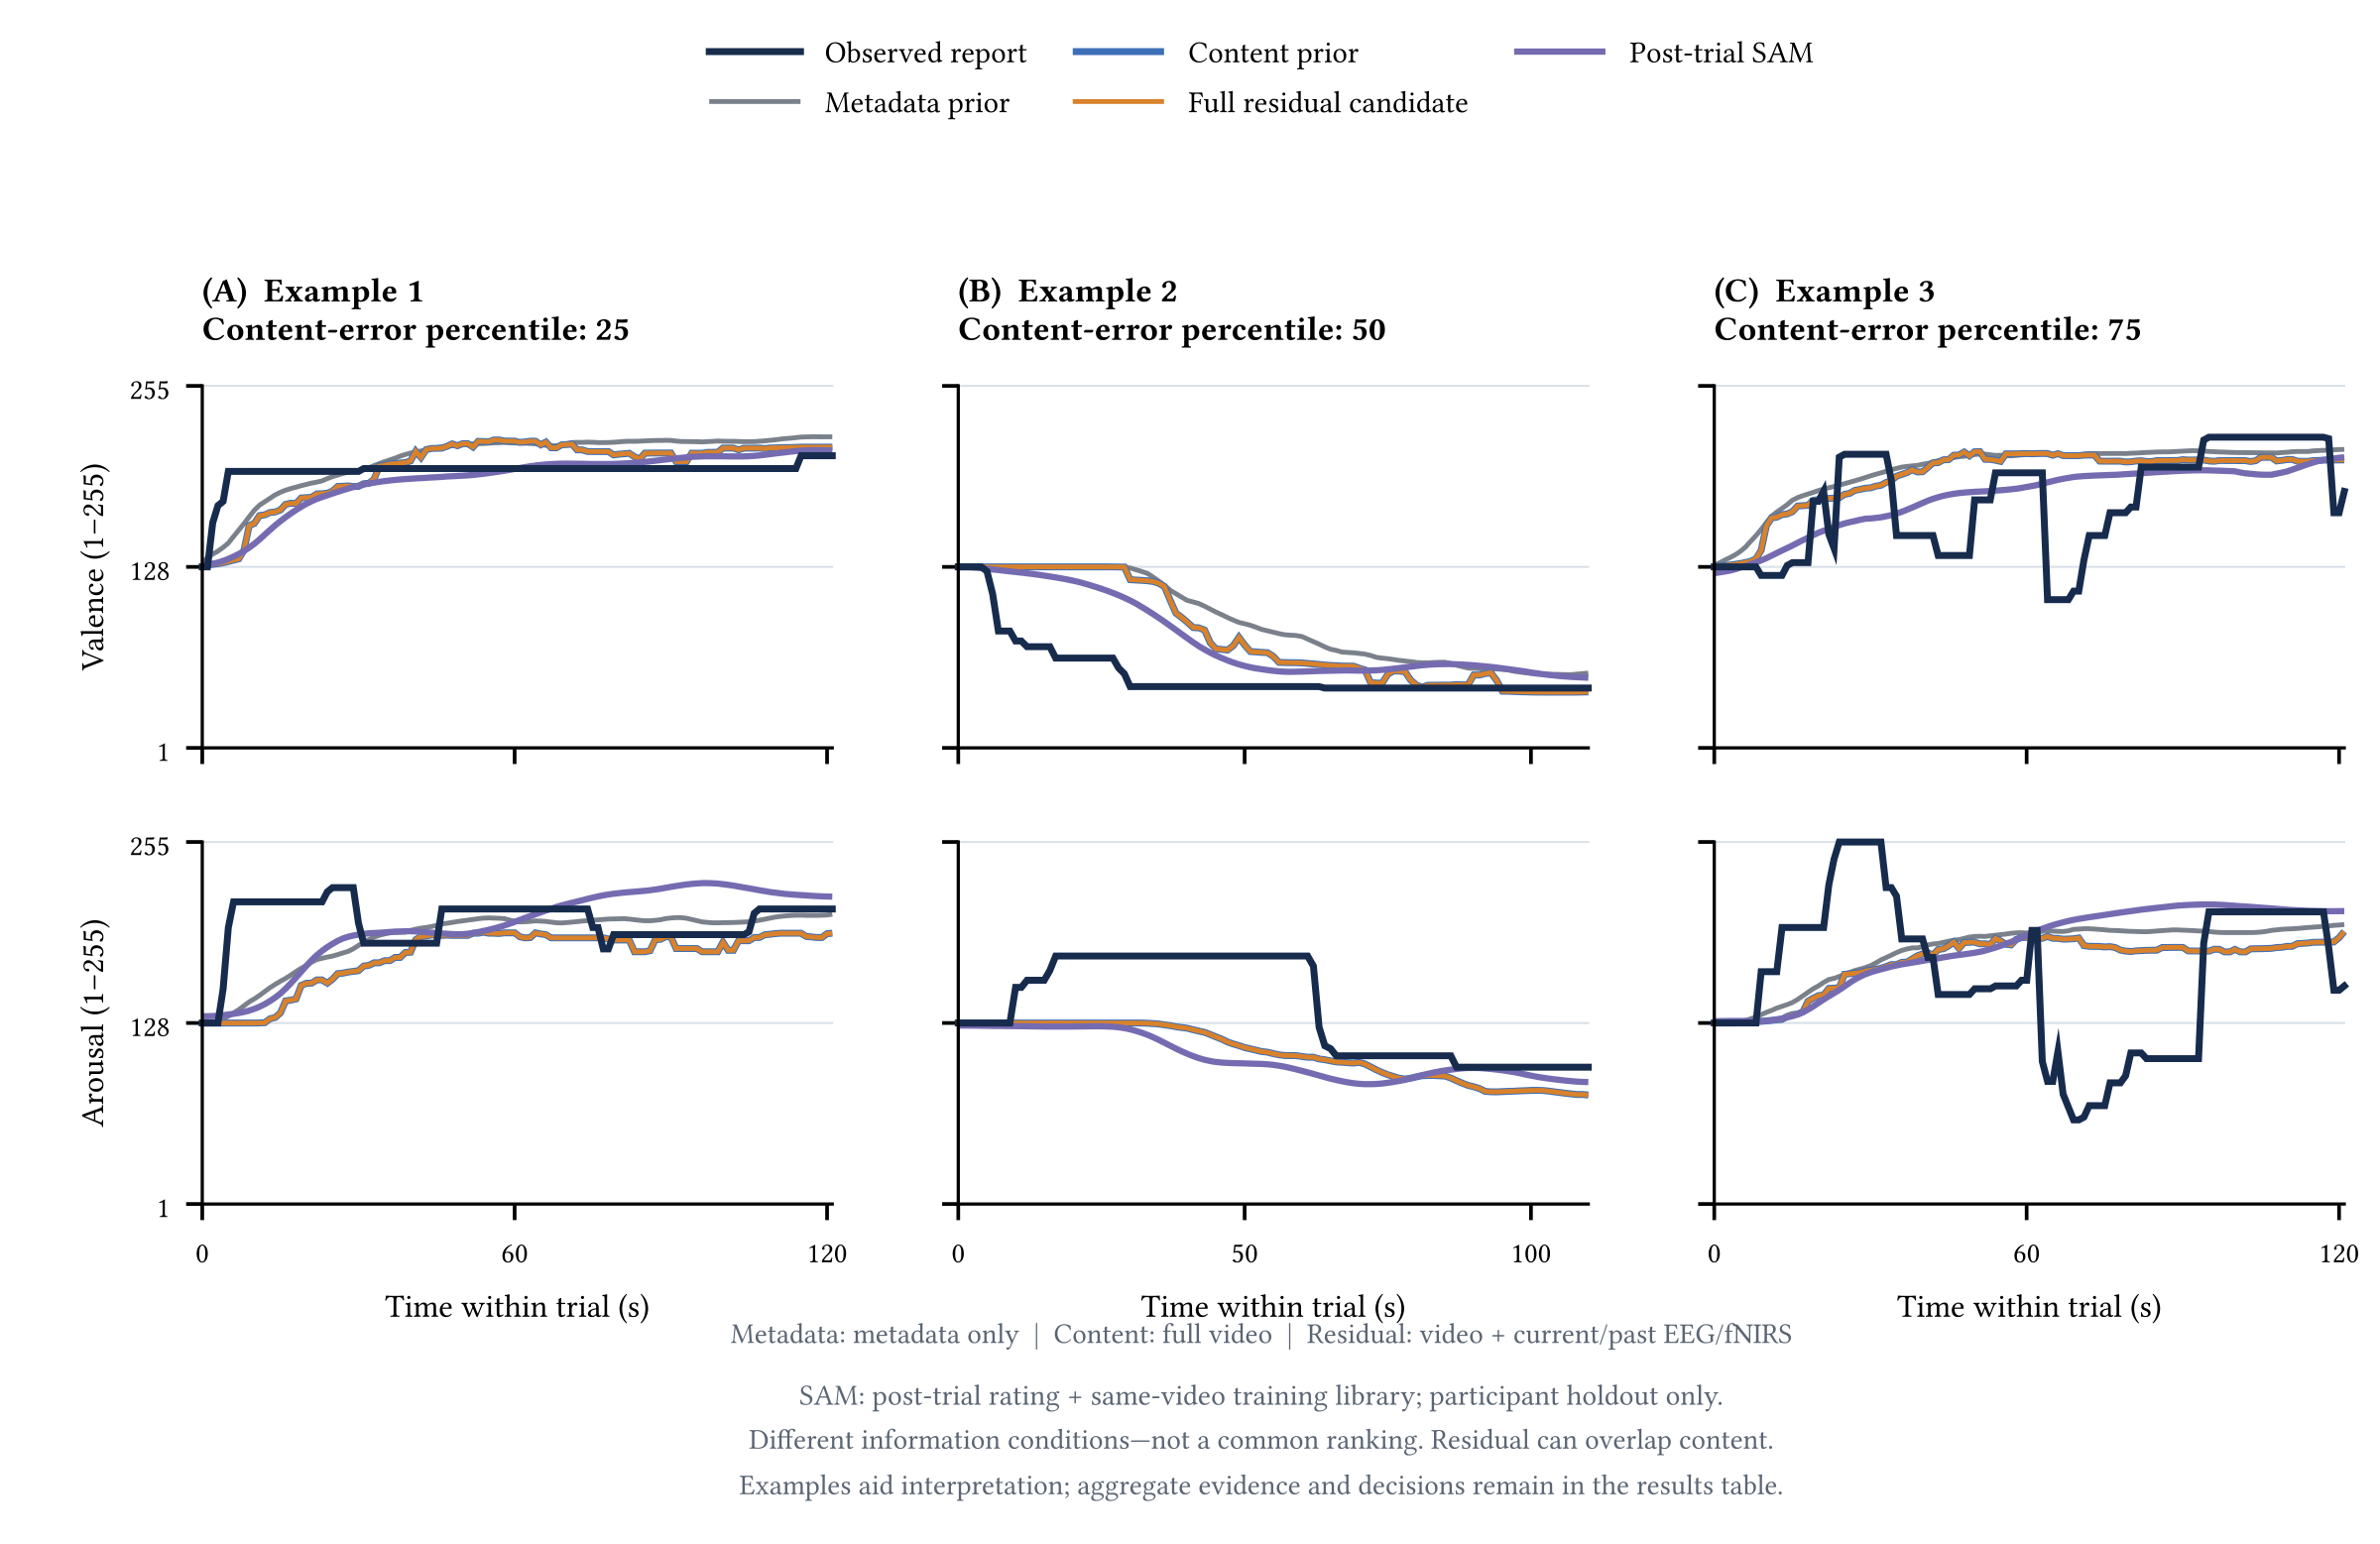
Content improved prediction over metadata within the released video library. Adding physiology did not demonstrate a further gain under the primary condition. Post-trial SAM improved reconstruction with feedback, not feedback-free or real-time prediction.
Selection gates and information boundaries
Relative error reduction: 0.069–0.208%. Calculated annotation exposure: 1.7–13.7 minutes, excluding setup and perceived burden.
The primary residual gate requires at least 0.10 label units of improvement on inner-fold predictions. The full evaluated procedure scored 30.499; disabling all residuals instead returns content at every sample, a distinct output. Looser 0.00 and 0.05 gates gave small positive estimates in sensitivity analyses.
The three illustrations and their plotted coordinates have an existing author-confirmed release scope. They exclude complete archives, original identifiers, participant mappings, and stimulus media.
View sourceThree anonymous trial illustrations near the 25th, 50th, and 75th percentiles of content-prior error. Every saved one-second sample is shown; examples illustrate the comparisons, not a common ranking.
Review Outcomes
The four uses call for separate decisions. Keeping a profile for later or using it elsewhere still requires evidence of stability, transfer, and reference-population coverage.
| Proposed use | Key evidence boundary | Resolved action |
|---|---|---|
| Interpret the profile | Evidence boundaryDepends on the measurement and reference conditions. | ActionLimit interpretation and use. |
| Add sensing | Evidence boundaryNo demonstrated gain over the matched comparator for this target. | ActionKeep the evaluated comparator. |
| Deploy calibration | Evidence boundaryReference error improved; direct user benefit was not tested. | ActionFirst run an in-context user study. |
| Retain or transfer | Evidence boundaryEvidence for stability, transfer, and reference coverage is missing. | ActionWithhold long-term retention and transfer. |
Case Details
What can this result tell us?
Proposed use
Interpret a profile calculated from the continuous self-report collected in one experiment.
Available evidence
The result changes with the interface, calculation method, and reference curve. It has not been checked in a repeat session.
Action and reason
Interpret it only within the tested settings and conditions.
This limits how the result can be interpreted and used. It neither approves personalization nor establishes a stable personal trait.
Evidence for re-review
Evidence matching the proposed interpretation, interface, estimator, reference group, and intended reuse period.
Responsible role in the record
Measurement-analysis lead
Reasoning and formal record
The original measure is a post-trial temporal-deviation profile relative to a reference. R1 limits its scope; permission to personalize is a separate decision.
- Original proposal
- Compute and interpret a post-trial temporal-deviation profile.
- Recorded evidence
- The trace is computable, but its magnitude changes with interface, estimator, and shared reference; no repeat session exists.
- Official decision
- Use the route only inside its evaluated evidence boundary
- Source review trigger (verbatim)
- Re-review before any durable-profile claim or after a new session, interface, estimator, or cross-video transfer study.
- Matched rule
- R1 · Interpretation and use cannot exceed the evaluated evidence scopeExecution priority: 40
| Field | Recorded state |
|---|---|
| evidence.interpretation_scope | PARTIAL |
| route_capability | AVAILABLE |
These are existing records resolved by the repository program. Re-review conditions summarize outstanding requirements; they are not observed outcomes or promises of permission.
Back to the person watching the video: the tested timing correction reduced error against the reference, but user benefit was not tested. Deploying it therefore requires a preregistered study in actual use; keeping the profile long term requires separate evidence.