Supplementary Analyses
These analyses diagnose mechanisms and implementation behavior. They are kept separate from the independent external-test result.
Multi-scale representations
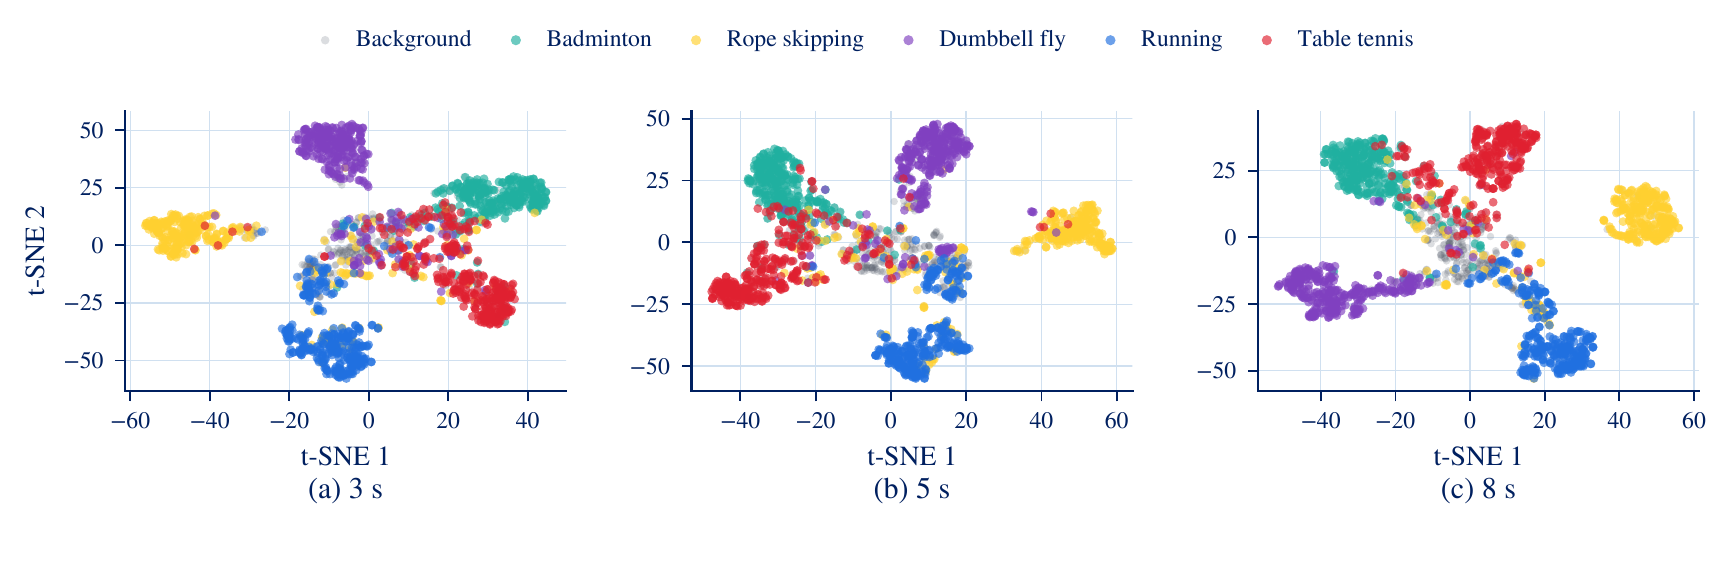
Short windows preserve transition detail; long windows add stable motion context. The t-SNE panels are qualitative diagnostics, not performance evidence.
TRL development diagnostics
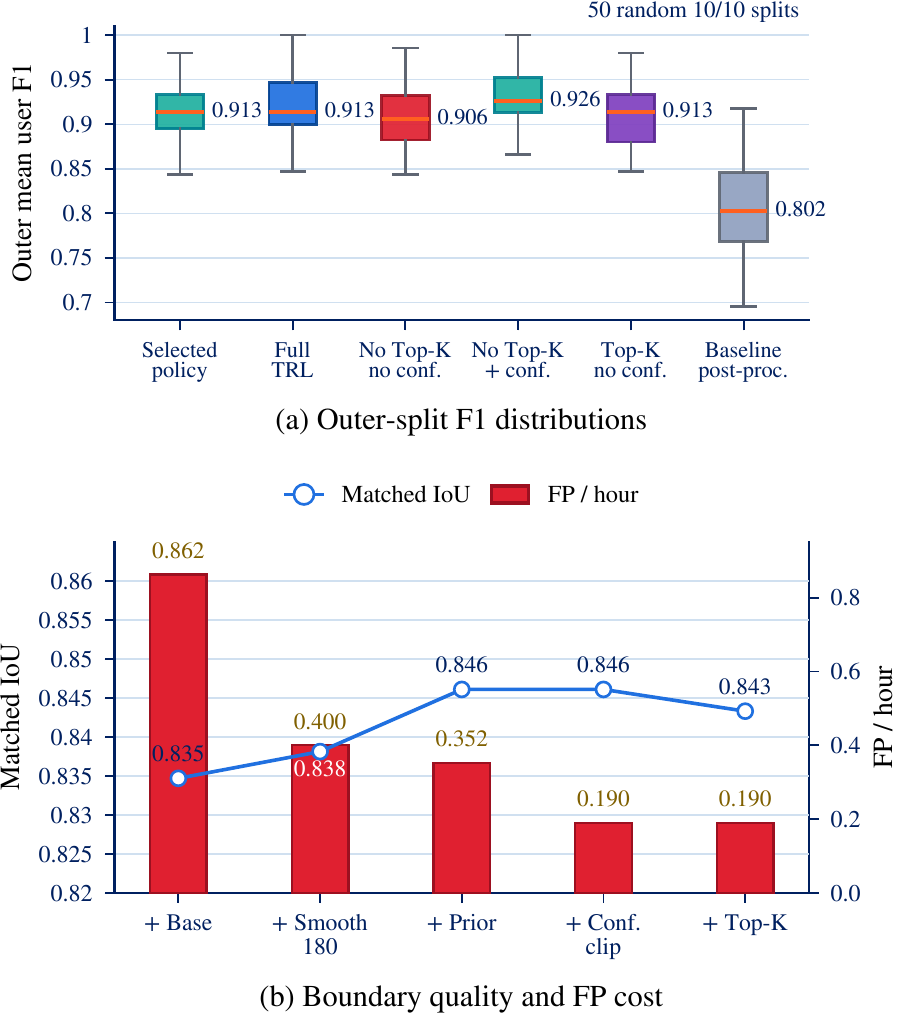
Across 50 development splits, TRL raises mean F1 from 0.802 to 0.913 and reduces false positives from 0.862 to 0.190 per hour. Matched IoU changes from 0.835 to 0.843. These values are development diagnostics and must not be reported as independent external-test performance.
Android implementation evidence
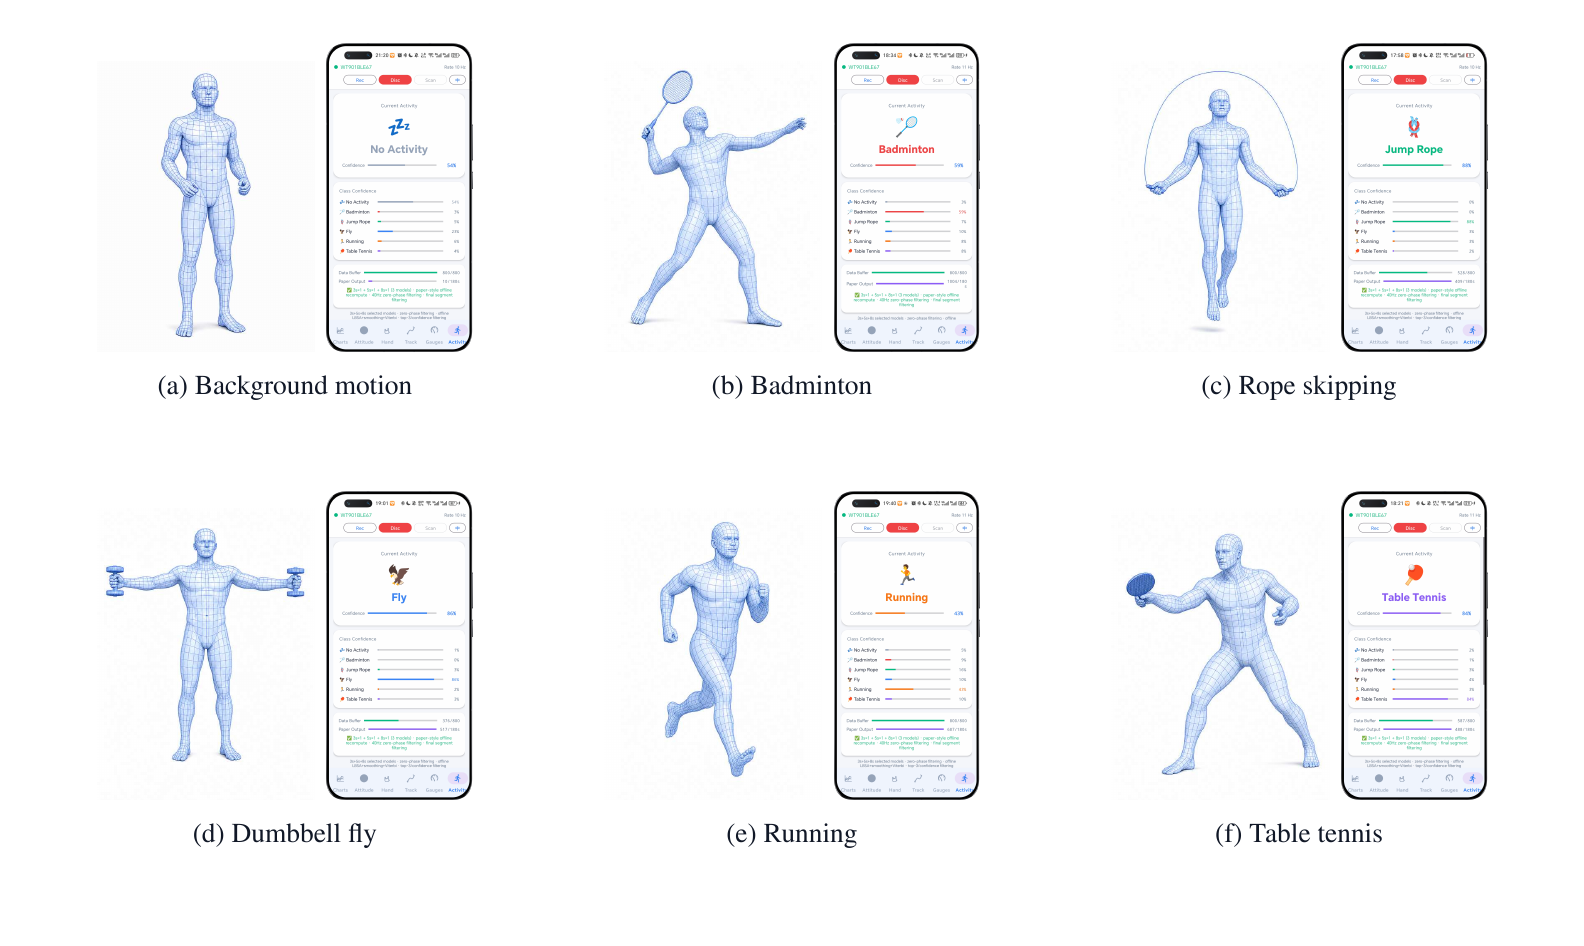
The Android prototype connects to a WT9011DCL-BT50 BLE IMU and runs the selected ONNX models with the temporal layer. The complete three-model pipeline averages 2.1 seconds per recording on the tested device. This demonstrates implementation feasibility, not a new benchmark.
Public-dataset portability
The following datasets do not match the wrist-sport protocol. The experiment only checks whether the temporal interface can be re-parameterized with dataset-specific models and policies.
| Dataset | Argmax F1 | TRL F1 | Argmax FP/h | TRL FP/h |
|---|---|---|---|---|
| HAR70+ | 0.70 | 0.70 | 47 | 45 |
| WISDM-phone | 0.05 | 0.37 | 83 | 5.7 |
| PAMAP2 | 0.09 | 0.53 | 90 | 9.3 |
| OPPORTUNITY | 0.29 | 0.29 | 320 | 110 |
These checks are not leaderboard comparisons and do not establish transfer of the HLS-HAR result. Return to the primary results or open the reproduction guide.